This feature requires additional development work to enable. Reach out to your Brightspot representative for more information.
Brightspot analytics
You can configure and view reports that display site- and asset-level analytics in a variety of graphical and tabular formats. You can also download the analytics in comma-separated values (CSV) format for analysis in a spreadsheet.
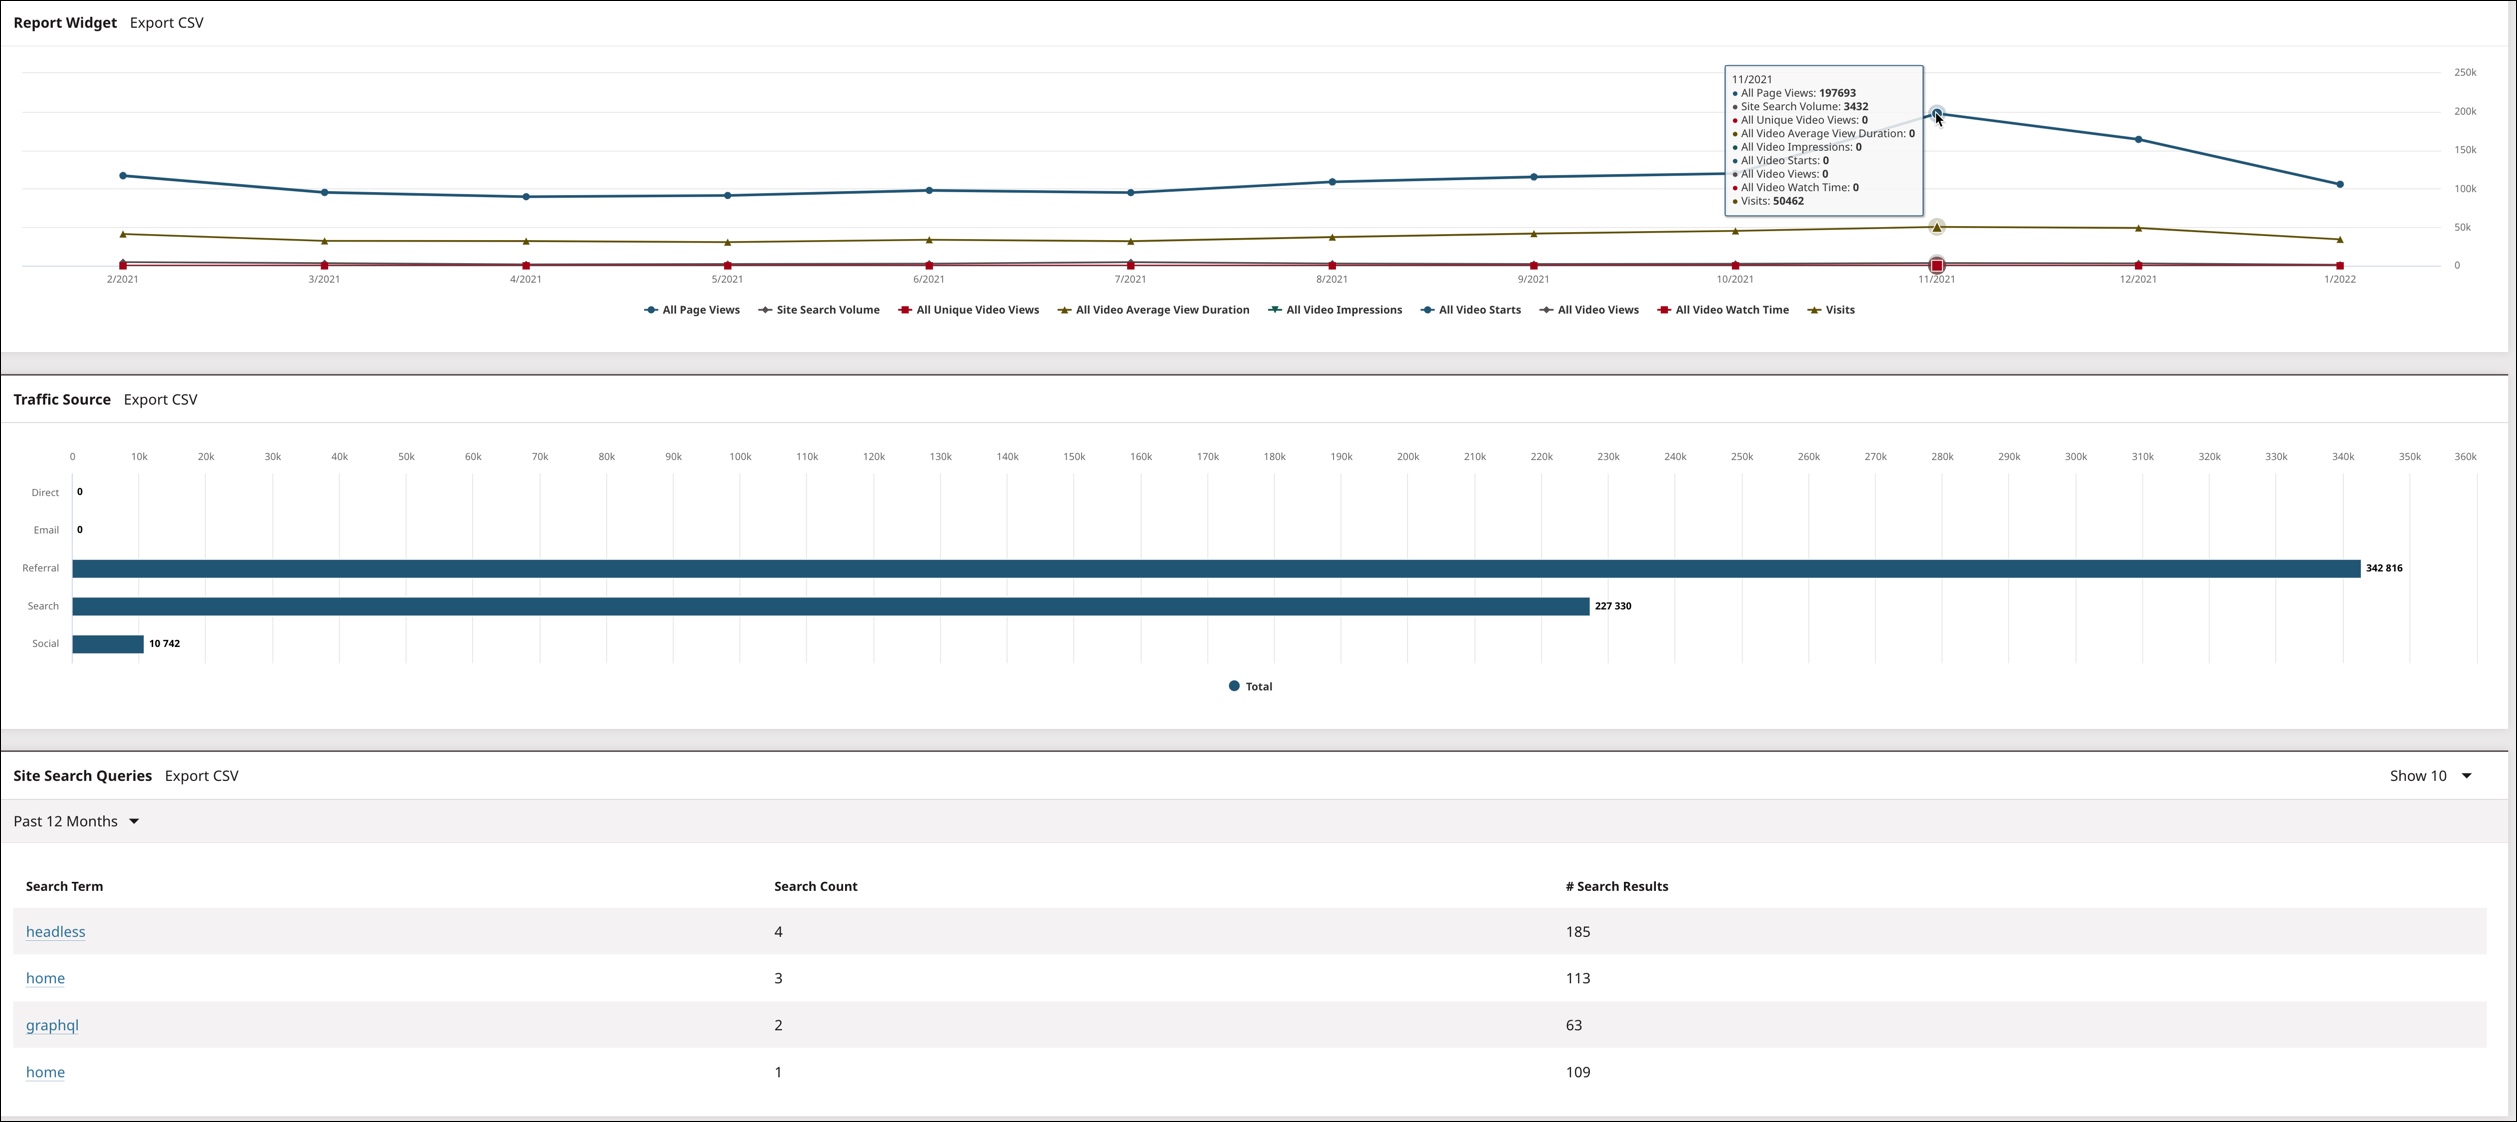
Below is a sample dashboard showing just a few of the types of metrics you can view.
Brightspot analytics provides the following metrics:
-
Pages
- Page Views
- Total Time on Page
- Visit Source (e.g., email, social media, search, etc.)
- Unique Visits
- Visits
-
Video
- Video Watch Percentage
- Video Watch Time
- Video Impressions
- Video Unique Views
-
Brightspot Site Search metrics
- Spotlight Clicks
- Spotlight Impressions
If your graphs show metrics not listed above, those metrics are visible due to third-party configurations and not supplied by Brightspot. See Google Analytics or Adobe Analytics for more information.
Configuring analytics in Brightspot
Brightspot accumulates and reports on visitors’ viewing patterns within your site. You can generate analytics accumulated by Brightspot (known as “Brightspot analytics”), or retrieve analytics from an integration with Google.
This section describes how to configure Brightspot to display page-view counts in the search panel and graphical analytics in an asset's content edit page.
To configure item-level analytics:
- From the left navigation, under Admin, click Sites & Settings, then select the Global site.
- Under CMS, expand Analytics.
- Using the following table as a reference, configure the analytics.
- Click Save.
Analytics settings - CMS tab
| Field | Description |
|---|---|
| Task Host | Name or address of host running the task that updates the page views. |
| Page Views Supplier | Supplier of page views. • None—Page-view data is accumulated by Brightspot analytics, but not displayed anywhere within Brightspot. • Brightspot Analytics—Brightspot collects the page-view data and displays results in the search panel and in an asset's content edit form. • Google Analytics 4—Brightspot retrieves the page-view data using Google Analytics 4, and displays the results in the search panel and in an asset's content edit form. For information about integrating Google Analytics 4 with Brightspot, see Adding the Google Analytics 4 integration. • Google Analytics: Universal Analytics—Brightspot retrieves the page-view data from Google Analytics: Universal Analytics, and displays the results in the search panel and in an asset's content edit form. For information about integrating Google Analytics: Universal Analytics with Brightspot, see Configuring Google Analytics. :::note Google discontinued support for Universal Analytics in July 2023. To retrieve Google Analytics data in Brightspot, select Google Analytics 4. ::: |
| Interval | Unit of time used to calculate the number of page views appearing in the search panel and in dynamic lists. See Including page views in the search panel and Sorting dynamic lists by page views. Available only if Page Views is set to Brightspot Analytics, Google Analytics 4 or Google Analytics: Universal Analytics. |
| Amount | Number of intervals. For example, if you set Interval to Days and Amount to 2, then the Page Views field in the search panel and dynamic lists reflects the number of page views over the past two days. Available only if Page Views is set to Brightspot Analytics, Google Analytics 4 or Google Analytics: Universal Analytics. |
| Disable Analytics HTML Tag Writer | :::note Depending on your implementation of Brightspot, this field may be named Disable Scripts.::: If toggled on, disables the JavaScript that triggers the collection of all data by Brightspot analytics. The data remains uncollected until you turn this toggle off. Also, historical data will continue to be displayed but will not be updated until this toggle is turned off. |
Viewing site-level analytics
Site-level analytics in Brightspot show you how your site is performing as a whole, as well as how individual assets within your site are performing. Site-level analytics are displayed on widgets that can be added to a dashboard.
Your site administrator can create a shared analytics dashboard, or you can create your own one-off dashboard with the desired analytics widgets. See Dashboards for more information.
Brightspot analytics tracks the following metrics at the site-level:
-
Page Views
-
Total Time on Page
-
Visit Source (e.g., email, social media, search, etc.)
-
Unique Visits
-
Visits
-
Video Watch Percentage
-
Video Watch Time
-
Video Views
-
Video Unique Views
-
Brightspot Site Search metrics
- Spotlight Clicks
- Spotlight Impressions
The following table lists the widgets you can place on your dashboard to display site-level analytics.
| Widget | Description | For more information, see… |
|---|---|---|
| Authorship | Displays readership analytics by author. | Configuring the Authorship widget |
| Report | Displays readership analytics for various metrics by various groupings. | Configuring the Report widget |
| Search spotlight performance | Displays number of click-throughs to a spotlight by search term. | Creating spotlights |
| Site search results | Displays the number of times readers searched for specific terms and the number of matching results. | Configuring site-search analytics |
Viewing asset-level analytics
Some analytics are also available at the individual asset level. The metrics available at the asset level are:
- Page Views
- Video Watch Percentage
- Video Watch Time
To view asset-level analytics:
-
Search for and open the asset's content edit page.
-
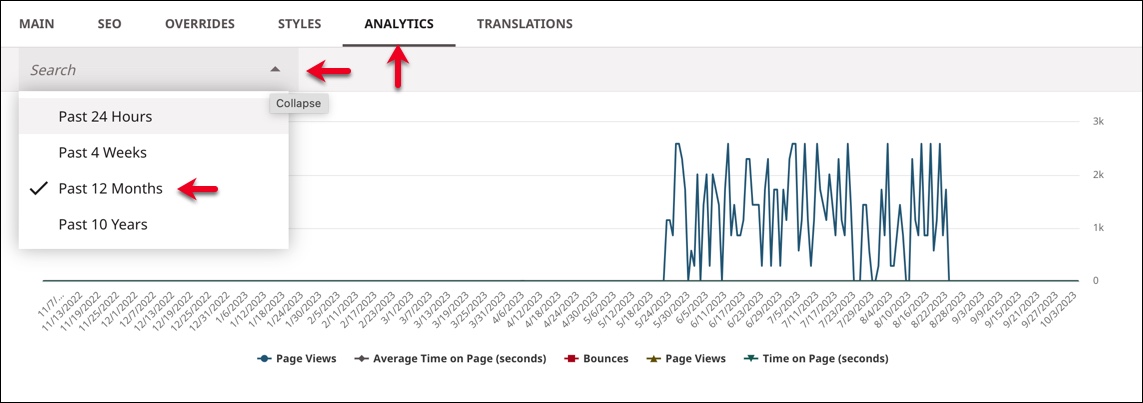
Open the Analytics tab.
-
Expand the time frame drop-down and select the time frame for which you would like to see the analytics for this asset.
 note
noteIf no analytics are available, Brightspot will display a message indicating this.
-
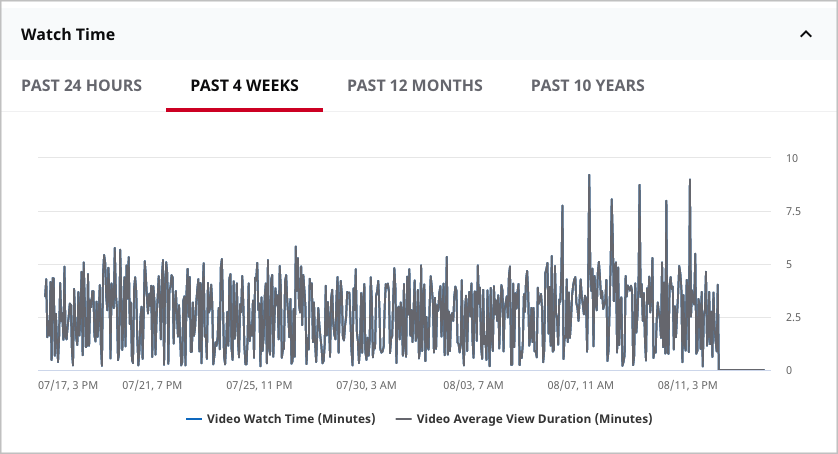
If the item you opened is a video, the content edit page includes two additional widgets:
-
Watch Funnel—Indicates the number of views as a percentage of video length in 10-percent increments.

-
Watch Time—Indicates watch time by time of day, and average view duration, in minutes.
-
You can toggle metrics on and off in the Analytics widget by clicking the metric name listed along the bottom of the widget. This can help reduce clutter and show you only the data you want to see at that time.
The following table describes the data series appearing in the Analytics widget.
Data series in the Analytics widget
| Series | Description |
|---|---|
| Average time on page | Average amount of time visitors spend on the page during a session. For more information, see GA avg time on page column. |
| Bounces | Number of times a visitor viewed the page and did not interact with it further. For example, a visitor loads a page and did not click on any of the links on that page. For more information, see Bounce rate. |
| Entrances | Number of times the page started a session on your site. For more information, see Difference between Entrances and Sessions. |
| Exit rate (percent) | Percentage of the page's views that are the last in a session. For more information, see Exit Rate vs. Bounce Rate. |
| Page value | The page's average value as a function of landing on one of your goal pages or before making a purchase. For more information, see How Page Value is calculated. |
| Page views | Number of times the page was successfully loaded in a browser or device. |
| Unique page views | Number of the page's views generated by the same visitor in the same session. For more information, see The difference between Google Ads Clicks, and Sessions, Users, Entrances, Pageviews, and Unique Pageviews in Analytics. |
Video-specific fields (appear when viewing video content):
| Series | Description |
|---|---|
| Video Impressions | Number of times the video was successfully loaded in a player on a page or device. |
| Video Starts | Number of times the video began playback. |
| Video Views | Number of times the video playback lasted at least three seconds. |
| Unique Video Views | Number of unique playbacks lasting more than three seconds. A unique view is a unique device-user-browser combination. |
Understanding time intervals for analytics
One of the settings you can configure for accumulating analytics is the time interval.
- Past Days, Past Hours, Past Months, and Past Years—Use one of these options to accumulate analytics over a unit of time that you specify.
- Set Day, Set Month, Set Week, and Past Years—Use one of these options to accumulate analytics for a specific unit of time.
Latest and earliest times in a reporting period
Brightspot applies the following logic to determine the latest and earliest times in a reporting period:
- Capture the current time.
- Compute the latest time in the interval by rounding down the current time to the requested unit.
- Compute the earliest time in the interval by subtracting the number of units (less one) from the latest time.
The following table provides examples for determining the reporting period for hours, days, months, and years.
| If you want analytics for the past… | and the current time is… | Latest time in reporting interval | Earliest time in reporting interval |
|---|---|---|---|
| Seven hours | August 15, 2019, 8:15 AM | August 15, 2019, 8:00 AM | August 15, 2019, 1:00 AM |
| Seven days | August 15, 2019, 8:15 AM | August 15, 2019, 12:00 AM | August 8, 2019, 12:00 AM |
| Seven months | August 15, 2019, 8:15 AM | August 1, 2019, 12:00 AM | January 1, 2019, 12:00 AM |
| Seven years | August 15, 2019, 8:15 AM | January 1, 2019, 12:00 AM | January 1, 2012, 12:00 AM |
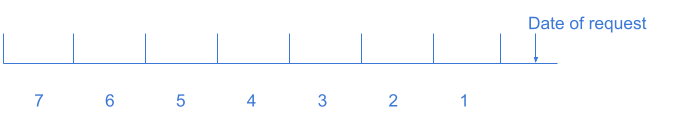
The following diagram illustrates the reporting interval for a seven-day report. The request was made during the day, and Brightspot accumulates data starting from the previous complete day for a total of seven days.
Adjusting for time zones in reporting periods
The times in the previous table are server times—the time on the Brightspot server. If your Brightspot server is in New York, then the server’s clock is most likely running on Eastern Standard Time or Eastern Daylight Time. (You can determine your server’s time zone by clicking > Sites & Settings > Global > Front-End > Time Zone.)
Suppose one of your sites addresses a market in London (Western European Time) and your Brightspot server is in New York (Eastern Standard Time). In this scenario, Brightspot accumulates the analytics after adjusting the counts for the five-hour difference.
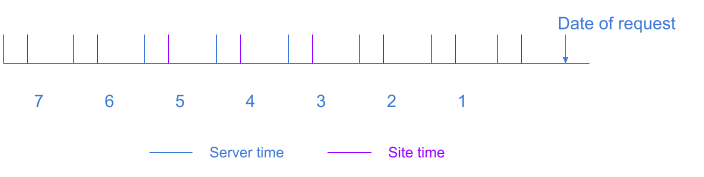
In the previous illustration, Brightspot adjusts the intervals forward by five hours (using the purple intervals), and then accumulates the analytics.
Including page views in the search panel
When you enable the Analytics plugin, you can include page views in the search panel’s results.
To include page views in the search panel:
-
In the header, click in the search field.
-
Click Select Fields.
-
From the Hidden Fields list, click Page Views. The field moves to the Selected Fields list.
noteYou can also type
Pagein the Filter by name field, to shorten the list of available fields to only those with the word page in the name. From this shortened list you can select the Page Views field. -
Click Update.
The Select Fields widget closes, and the Page Views field appears in the search panel.
You can also filter search results by page views using an advanced query; for details, see Advanced query search
See also:
Sorting dynamic lists by page views
When you enable Brightspot analytics, you can configure your dynamic lists to sort by page views. This ensures that your dynamic lists are populated with assets that have the most views.
To sort a dynamic list by page views:
-
Open or create the asset to which you want to add a dynamic list.
-
Choose the position where you want the dynamic list to appear on the asset.
-
From the Overrides tab, expand the Layout Overrides cluster.
-
Three drop-down lists, Above, Aside, and Below are available to set the dynamic list’s position. (For an illustration of these positions, see Layout).
-
Select the position for the dynamic list and expand its list.
-
Select Replace.
For example, if you want only the dynamic list to display above all of the content on the page, expand the Above drop-down list and select Replace, as seen in the image below.
-
-
Click , and select List.
-
If available, select the list style.
-
In the Title field, enter a title.
-
In the Description field, enter a description. For an explanation of the buttons on this field’s toolbar, see Rich-text editor.
-
From the Items list, select Dynamic. Once you set your list to dynamic, you must create the conditions for assets to be pulled into the list.
-
Expand Types and select the content types to populate the list.
-
Expand Sort and select Page Views.
-
Enter the number of assets to be displayed in the list in the Items Per Page field.
noteSee Understanding dynamic list settings for complete details on all of the fields available when configuring a dynamic list.
-
-
From the Call to Action list, select a call to action.
-
If you added a Call to Action, complete the Call to Action Button Text field.
-
Click Publish.
Site-search analytics
With the site-search analytics plugin, you have visibility into those terms visitors are searching for on your website. You can use site-search analytics to address the following scenarios:
- Visitor interest—The site-search analytics widget lists the terms visitors are searching for on your site. This gives you insight into what their interests are, so you can develop additional content to address those interests; it also illustrates what topics do not interest visitors.
- Missing content—The site-search analytics widget reports that visitors are searching for certain terms, but there is no content associated with those terms. This shows that you need to develop new content to address those interests.
- Timing of search counts—You run a radio advertisement for your site with an announcement “Are there UFO landing sites near you? Go to ISawItFirst.com, and search for crop circles.” If the site-search analytics widget reports a spike in searches for “crop circles” shortly after that advertisement, you have a good indication of the ad’s impact.
Configuring site-search analytics
This section describes how to configure site-search analytics in Brightspot.
To configure site-search analytics:
- From the left navigation, under Admin, click Sites & Settings.
- Select a site with which you want to use site-search analytics.
- Add the Site Search Results Widget to your users’ dashboards. For details about adding widgets to dashboards, see Creating a shared dashboard.
- Click Save.
Brightspot adds a Site Search Queries widget to the dashboard.
Viewing site-search statistics
You can view statistics for site searches—terms for which visitors are searching on your site.
To view site-search analytics:
- In your dashboard, scroll to the Site Search Queries widget. For an explanation of the columns in this widget, see the table "Columns in Site Search Queries widget" below.
- From the leftmost list, select the time period for which you want to view site-search statistics.
- From the rightmost list, select the number of terms you want to view in the widget.
- Click the term to view analytics for the items associated with the term (see the table "Columns in Site Search Term Analytics widget" below).
- To perform additional analysis with a spreadsheet application, download the statistics by clicking Export CSV.
The following table describes the columns in the Site Search Queries widget.
Columns in Site Search Queries widget
| Column | Definition |
|---|---|
| Search Term | Terms visitors search for in your site's search field. |
| Search Count | Number of times visitors searched for the search term. |
| # Search Results | Number of items in your site that are associated with the search term. |
Columns in Site Search Term Analytics widget
| Column | Description |
|---|---|
| Search Result | Items associated with the term you clicked in the Site Search Queries widget. |
| Clicks | Number of times visitors arrived at the item from your site's search results page. |
| Spotlight | Promo that appears with the item when a visitor arrives at the item from your site's search results page. |