Adobe Analytics
You can configure the Adobe Analytics integration to ingest Adobe metrics into Brightspot. Once configured, you can set up reports to feed metrics to either a site via the dashboard or to an asset via the Analytics tab.
Including Adobe Analytics in a build
| Artifact | Description |
|---|---|
com.psddev:adobe-analytics | Exposes core Adobe Analytics functionality for configuration. Note that in order to have data accessible in a report widget, your project must also include the com.psddev:reporting dependency. |
Configuration overview
To configure the Adobe Analytics integration, you take the following steps:
-
Add Adobe Analytics at the global level. For details, see Adding the Adobe Analytics integration.
-
Configure a site to retrieve Adobe Analytics data. For details, see Configuring a site to retrieve Adobe Analytics data.
-
Import a report suite that you use to configure reports. For details, see Importing an Adobe Analytics report suite.
-
Configure the reports themselves. For details, see the following topics:
- Setting up an Adobe Analytics page report (asset-level metrics)
- Setting up an Adobe Analytics devices report (site-level metrics)
- Setting up an Adobe Analytics referral report (site-level metrics)
- Setting up an Adobe Analytics site calculated report (site-level metrics)
- Setting up an Adobe Analytics site report (site-level metrics)
-
(Optional) Enable archival reports for debugging and auditing. For details, see Enabling archival reports.
-
Populate asset-level analytics via the Analytics tab. For details, see Populating asset-level Analytics widget with Adobe Analytics data.
-
Populate site-level analytics via the dashboard. For details, see Populating an Analytics dashboard with site-level Adobe Analytics data.
How Brightspot displays data
Brightspot displays Adobe Analytics data in two ways:
- At the site level, via Report widgets that you configure when creating dashboards. For details, see Populating an Analytics dashboard with site-level Adobe Analytics data.
- At the asset level, via the Analytics tab on an asset's content edit page. For details, see Populating asset-level Analytics widget with Adobe Analytics data.
Adding the integration
To use Adobe Analytics, you must first integrate it at the Global level.
To integrate Adobe Analytics at the Global level:
- From the left navigation, under Admin, click Sites & Settings, then select the Global site.
-
Under the CMS tab, expand Advanced.
-
Ensure that a Default Task Host has been defined.
-
Under the Integrations tab, expand Adobe Analytics.
-
Toggle on Enabled.
-
Under Task Host, enter the same value as found or entered in step 3.
-
Under the CMS tab, expand Analytics.
-
Under Page Views Supplier, select Adobe Analytics.
warningConfiguring this integration requires that Adobe Analytics is your only analytics provider. If you already have a different analytics provider set in this field, then selecting Adobe Analytics may break the connection with existing analytics.
-
Under Interval, select the time interval by which you want to track analytics metrics.
-
Under Amount, specify the number of units pertaining to the interval you selected in the previous step. For example, if you set the Interval field to Days, then you may elect to enter
7in this field. -
Click Save.
Once you have added the integration, proceed to Configuring your site to retrieve Adobe Analytics data.
Configuring a site to retrieve data
Before displaying Adobe Analytics metrics at the site or asset level, you must first configure the site to retrieve this data. While this topic explains how to do this at the site level, you may also configure these settings at the Global level, after which all sites inherit the configuration; however, before configuring these settings, ensure that the integration has been added at the Global level. For details, see Adding the Adobe Analytics integration.
To configure a site to retrieve Adobe Analytics data:
-
In the Adobe Analytics console, retrieve the following values:
- Global company ID
- Client ID
- Client secret
- From the left navigation, under Admin, click Sites & Settings.
-
In the Sites widget, select the site for which you want to configure this integration.
-
Under the Integrations tab, expand Adobe Analytics.
-
Under API Settings, select Set.
-
Retain the value in the Base URL field.
-
In the Global Company ID, Client ID, and Client Secret fields, enter the values retrieved in step 1 (Brightspot populates the API Key field with the same value you paste into the Client ID field).
-
Click Save.
Once you have configured your site to retrieve Adobe Analytics, you must import a report suite from Adobe. For details, see Importing an Adobe Analytics report suite.
Importing report suites
Report suites host the reports you configure, as well as their metrics, that you later display at either the site or asset level. Before importing a report suite, you must configure the Adobe Analytics integration at either the Global or site level. For details on this prerequisite process, see Configuring a site to retrieve Adobe Analytics data.
To import an Adobe Analytics report suite:
- From the left navigation, under Adobe Analytics, click Reports Suites.
-
Under Report Suite, select the report suite you want to import.
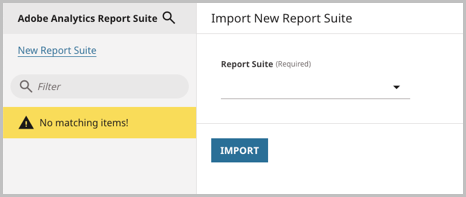
-
Click Import.
-
Click Done.
You can use the search field in the left rail to filter for imported report suites.
Brightspot displays a form with read-only metadata pertaining to the imported report suite. From the Reporting tab, you can do the following:
-
View information about when the report suite was imported and when its most recent run occurred.
-
Configure reports, which is a necessary next step in integrating with Adobe Analytics. For details, see:
- Setting up an Adobe Analytics page report (asset-level metrics)
- Setting up an Adobe Analytics devices report (site-level metrics)
- Setting up an Adobe Analytics referral report (site-level metrics)
- Setting up an Adobe Analytics site calculated report (site-level metrics)
- Setting up an Adobe Analytics site report (site-level metrics)
-
Enable archival reports for debugging and auditing. For details, see Enabling archival reports.
Enabling archival reports
You can enable archival reports for debugging and auditing your Adobe Analytics reports. For every report that is generated, you can save it to a storage service of your specification.
To enable archival reports:
- From the left navigation, under Adobe Analytics, click Reports Suites.
- Select the report suite for which you want to enable archival reports.
- Under the Reporting tab, expand Archival.
- Toggle on Archival Enabled.
- Under Archives Base Path, specify the path where the .csv file containing the archive needs to be saved (for example, an S3 or Google Drive storage path).
- Click Save.
Setting up reports
Page reports
Page reports are the method by which you can track and display asset-level Adobe Analytics data. You configure a page report only after importing a report suite, which populates the metrics required to build the page report. For details on importing a report suite, see Importing an Adobe Analytics report suite.
To set up an Adobe Analytics page report:
- From the left navigation, under Adobe Analytics, click Reports Suites.
-
Select the report suite in which you want to configure the page report.
-
In the Reporting tab, under Reports, select Page Report.
-
Under Content Resolver, retain Page URL.
noteThe following fields have values that are dynamically populated by Adobe Analytics. What you select in the following fields depends entirely on your specific project, business needs, report suite, API, and other variables; therefore, Brightspot recommends performing an analysis on these components before selecting values in the following fields. For that reason, this topic does not (and cannot) provide exact values.
For more information on metrics in Adobe Analytics, see Metrics overview.
-
Under Content Identifier Dimension, select a dimension (for example,
URL <v4> (variables/evar4)). -
Under Screen Page Views Metric, select a metric (for example,
Page Views (metrics/pageviews)). -
Under User Engagement Duration Metric, select a metric (for example,
Average Time Spent on Page (seconds) (metrics/averagetimespentonsite)). -
Under Sessions Metric, select a metric (for example,
Visits (metrics/visits)). -
Under Active Users Metric, select a metric (for example,
Unique Visitors (metrics/visitors)). -
Click Save.
After saving, you can view information related to how current your metrics are by checking the report's Reporting tab.
Device reports
Device reports provide insight into the devices your visitors use to visit your site (for example, mobile, tablet, and other devices like desktop). You configure a devices report only after importing a report suite, which populates the metrics required to build the devices report. For details on importing a report suite, see Importing an Adobe Analytics report suite.
To set up an Adobe Analytics devices report:
- From the left navigation, under Adobe Analytics, click Reports Suites.
-
Select the report suite in which you want to configure the device report.
-
In the Reporting tab, under Reports, select Devices Report.
noteThe following fields have values that are dynamically populated by Adobe Analytics. What you select in the following fields depends entirely on your specific project, business needs, report suite, API, and other variables; therefore, Brightspot recommends performing an analysis on these components before selecting values in the following fields. For that reason, this topic does not (and cannot) provide exact values.
For more information on metrics in Adobe Analytics, see Metrics overview.
-
Under Device Category Dimension, select a dimension (for example,
Mobile Device Type (variables/mobiledevicetype)). -
Under Screen Page Views Metric, select a metric (for example,
Page Views (metrics/pageviews)). -
Click Save.
After saving, you can view information related to how current your metrics are by checking the report's Reporting tab.
Referral reports
Referral reports provide insight into the referrer that brought a visitor to your site for the first time. You configure a referrer report only after importing a report suite, which populates the metrics required to build the referrer report. For details on importing a report suite, see Importing an Adobe Analytics report suite.
To set up an Adobe Analytics referral report:
- From the left navigation, under Adobe Analytics, click Reports Suites.
-
Select the report suite in which you want to configure the referral report.
-
In the Reporting tab, under Reports, select Referral Report.
noteThe following fields have values that are dynamically populated by Adobe Analytics. What you select in the following fields depends entirely on your specific project, business needs, report suite, API, and other variables; therefore, Brightspot recommends performing an analysis on these components before selecting values in the following fields. For that reason, this topic does not (and cannot) provide exact values.
For more information on metrics in Adobe Analytics, see Metrics overview.
-
Under First Touch Channel Dimension, select a dimension (for example,
First Touch Channel (variables/firsttouchchannel)). -
Under Screen Page Views Metric, select a metric (for example,
Page Views (metrics/pageviews)). -
Click Save.
After saving, you can view information related to how current your metrics are by checking the report's Reporting tab.
Site calculated reports
Site calculated reports provide insight into average-related and bounce-rate-related metrics around events. You configure a site calculated report only after importing a report suite, which populates the metrics required to build the site calculated report. For details on importing a report suite, see Importing an Adobe Analytics report suite.
To set up an Adobe Analytics site calculated report:
- From the left navigation, under Adobe Analytics, click Reports Suites.
-
Select the report suite in which you want to configure the site calculated report.
-
In the Reporting tab, under Reports, select Site Calculated Report.
noteThe following fields have values that are dynamically populated by Adobe Analytics. What you select in the following fields depends entirely on your specific project, business needs, report suite, API, and other variables; therefore, Brightspot recommends performing an analysis on these components before selecting values in the following fields. For that reason, this topic does not (and cannot) provide exact values.
For more information on metrics in Adobe Analytics, see Metrics overview.
-
Under Screen Page Views Metric, select a metric (for example,
Visits (metrics/visits)). -
Under Sessions Metric, select a metric (for example,
Average Page Views per Visit (metrics/pageviewspervisit)). -
Under Engaged Sessions Metric, select a metric (for example,
Average Time Spent on Site (seconds) (metrics/averagetimespentonsite)). -
Under User Engagement Duration Metric, select a metric (for example,
Bounce Rate (metrics/bouncerate)). -
Under Total Users Metric, select a metric (for example,
Page Events (metrics/pageevents)). -
Click Save.
After saving, you can view information related to how current your metrics are by checking the report's Reporting tab.
Site reports
Site reports provide insight into general metrics like page views, visits, engagements, average time spent on page, and unique visitors. You configure a site report only after importing a report suite, which populates the metrics required to build the site report. For details on importing a report suite, see Importing an Adobe Analytics report suite.
To set up an Adobe Analytics site report:
- From the left navigation, under Adobe Analytics, click Reports Suites.
-
Select the report suite in which you want to configure the site report.
-
In the Reporting tab, under Reports, select Site Report.
noteThe following fields have values that are dynamically populated by Adobe Analytics. What you select in the following fields depends entirely on your specific project, business needs, report suite, API, and other variables; therefore, Brightspot recommends performing an analysis on these components before selecting values in the following fields. For that reason, this topic does not (and cannot) provide exact values.
For more information on metrics in Adobe Analytics, see Metrics overview.
-
Under Screen Page Views Metric, select a metric (for example,
Page Views (metrics/pageviews)). -
Under Sessions Metric, select a metric (for example,
Visits (metrics/visits)). -
Under Engaged Sessions Metric, select a metric (for example,
New Engagements (metrics/newengagements)). -
Under User Engagement Duration Metric, select a metric (for example,
Average Time Spent on Page (seconds) (metrics/averagetimespentonsite)). -
Under Total Users Metric, select a metric (for example,
Unique Visitors (metrics/visitors)). -
Under New Users Metric, select a metric (for example,
Unique Visitors (metrics/visitors)). -
Click Save.
After saving, you can view information related to how current your metrics are by checking the report's Reporting tab.
Displaying analytics
Site-level analytics
Once you set up an Adobe Analytics site-level report, you must configure a Report widget on the dashboard that displays its metrics. One Report widget houses one site report and its metrics; therefore, to display metrics from both a device report and a site report, for example, you must make two Report widgets. For details on how to set up the prerequisite Adobe Analytics reports, see the topics below:
- Setting up an Adobe Analytics devices report
- Setting up an Adobe Analytics referral report
- Setting up an Adobe Analytics site calculated report
- Setting up an Adobe Analytics site report
The procedure in this topic assumes that you are creating a dashboard from scratch, to which you then build Report widgets to display Adobe Analytics; however, you may also access an existing one-off or shared dashboard and add Report widgets to it.
To populate an Analytics dashboard with site-level Adobe Analytics data:
- From the left navigation, under Admin, click Dashboards.
-
Under Name, give the dashboard a name (for example,
Adobe Analytics Dashboard). This is an internal name used to help identify this dashboard among others in the Dashboards area. -
Under Main Tab Name, override the default main tab name (
Main) to something that indicates what this dashboard displays (for example,Analytics). -
Under Main Tab Columns, under Widgets, click , then select Report Widget.
-
In the Heading field, give the widget a name (for example,
Site Report Metrics). -
In the Reporter field, select Area Filled.
-
In the Supplier field, select Numbers Over Time.
-
In the Series field, select Adobe Analytics (Site).
-
Under Report Suite, select the report suite in which you configured an Adobe Analytics site-level report. For details, see Importing an Adobe Analytics report suite.
-
Under Report, select the specific report whose metrics you want to display in the widget:
-
Under Metric, select the specific metric you want to display in the widget.
-
To add additional metrics, click and then repeat steps 9–11; however, to save time, refer to the tip below.
tipTo save time, in the Series object you just configured, click > Copy to produce a copy, then update the selection in the copy's Metric field.
-
Under Period, select the time period to be displayed in the widget by default (for example, Set Month).
-
Repeat steps 1–13 to add additional Report widgets that display other reports and their metrics.
-
Click Save.
Asset-level analytics
Once you configure an Adobe Analytics page report, you must apply its metrics to your site's assets so that they show up in an asset's Analytics tab. For details on page reports, see Setting up an Adobe Analytics page report.
To populate an asset-level Analytics widget with Adobe Analytics data:
- From the left navigation, under Admin, click Sites & Settings.
-
In the Sites widget, select the site for which you want to configure this setting.
-
Under the CMS tab, expand Adobe Analytics.
-
Under Page Metrics to Display, click , then do the following:
- Under Report Suite, select the report suite in which you configured an Adobe Analytics page report. For details, see Setting up an Adobe Analytics page report.
- Under Metric(s), select the metrics that populate an asset's Analytics tab.
-
Click Save.