Dashboards
The dashboard is your starting point for creating and managing content in Brightspot. It contains widgets for performing common activities, such as creating a new article or video, reviewing recent activity and scheduled events, or uploading images and other file types.
The dashboard is organized into tabs, columns, and widgets.

In the illustration above—
- The dashboard has three tabs, and the Editing tab is currently active.
- The Editing tab has been configured with two columns containing the Quick Start widget, Scheduled Events widget, and Recent Activity widget.
Brightspot comes with a standard dashboard, and provides several widgets you can use to customize your dashboards. Custom dashboard widgets can be created to fit your organization's practices or your own workflow.
Dashboard hierarchy
Brightspot has four levels of dashboard hierarchy:
- Global—Dashboard created at the global level. This is the default dashboard for all users who do not have a site-level, role-level, or user-level dashboard applied.
- Site—Dashboard created at the site level. This is the default dashboard for all users on a particular site who do not have a role-level or user-level dashboard applied.
- Role—Dashboard created at the role level. This is the default dashboard for all users in a particular role who do not have a user-level dashboard applied.
- User—Dashboard at the individual user level. This dashboard takes precedence over all other levels of dashboards and is only seen by the user to whom it is applied.
Configuring dashboards in a hierarchy promotes consistency among similar users, such as those in the same role or those working on the same site.
Precedence of dashboard settings
If a setting is configured on multiple dashboards, Brightspot uses the setting with the highest level of precedence. The following table describes the setting logic when four dashboards are configured at the global, site, role, and user levels.
| Settings | Global | Site | Role | User | Setting Used |
|---|---|---|---|---|---|
| Widget layout | Settings applied | - | - | Settings applied | User |
| Resources widget | Settings applied | - | Settings applied | - | Role |
| Upload widget | Settings applied | Settings applied | - | - | Site |
| Workstreams widget | Settings applied | - | - | - | Global |
Referring to the previous table—
- Brightspot uses the Widget layout setting configured at the user level. Those users that did not configure this setting would see the global setting.
- Because no Resources widget setting is configured at the user level, Brightspot uses the Resources widget setting at the role level. In this case, all users with the particular role would see the settings specified at the role level. Those users who do not have the role would see the global setting.
- Because no Upload widget setting is configured at the user or role levels, Brightspot uses the Upload widget at the site level. All users working on the site where this setting was configured would see the settings specified at the site level. Users not working on that site would see the global settings.
- Because no Workstreams widget setting is configured at the user, role, or site levels, Brightspot uses the Worksteams widget setting at the global level. All users would see this setting.
Shared dashboards and multiple roles
Editors with more than one role have access to each role's dashboard. For example, Adam is an editor associated with the Editor and Writer roles. When opening his dashboard, he sees two tabs, each one containing the dashboard for his associated roles.

Shared vs. one-off dashboards
You can create dashboards in either a shared or one-off way.
- Shared dashboards are built once and reused in many places, like other sites, other roles, or other users.
- One-off dashboards are built once and used in one place.
Below are examples of one-off and shared dashboards:
- A writer wants to keep a link to the department's writing style guide close at hand. The writer builds a one-off dashboard and ensures that the Resources widget is included.
- A managing editor wants to give all reporters the ability to bulk upload images. The editor builds a shared dashboard for all reports that includes the Upload widget.
- A site administrator wants all sites and respective teams to have access to analytics and site search data. The administrator builds a shared dashboard at the global level and ensures that the Report and Site Search widgets are included.
Creating a one-off dashboard
A one-off dashboard is dedicated to the site, role, or user, role for which it is created. Other sites, roles, and users cannot reuse one-off dashboards.
The following procedure describes how to create a one-off dashboard.
If you replace a one-off dashboard with another dashboard, Brightspot permanently deletes the replaced dashboard.
- Do one of the following:
| To create the dashboard... | Start by... |
|---|---|
| At the global level | 1. From the left navigation, under Admin, click Sites & Settings, then select the Global site. 2. From the CMS tab, expand the Dashboard cluster. |
| At the site level | 1. From the left navigation, under Admin, click Sites & Settings. 2. Under Sites, click the site for which you want to create a one-off dashboard. 3. From the CMS tab, expand the Dashboard cluster. |
| At the role level | 1. From the left navigation, under Admin, click Users & Roles. 2. Under Roles, click the role for which you want to create a one-off dashboard. 3. Toward the right of the widget, click > Dashboard. |
| At the user level | 1. From the left navigation, under Admin, click Users & Roles. 2. Under Users, click the user for which you want to create a one-off dashboard. 3. Under CMS, expand Dashboard. |
| As your default dashboard | 1. In the header, click your username, and then click Profile. 2. Under CMS, expand Dashboard. |
-
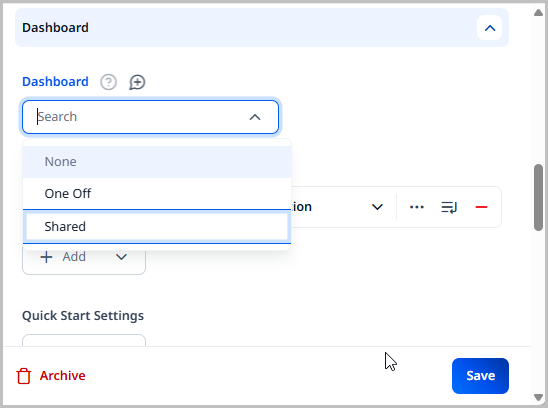
From the Default Dashboard list, select One Off (in some Brightspot instances, this field may be called the Dashboard field).
-
In the Name field, enter a name for the dashboard. This name is used internally to reference this dashboard.
-
In the Main Tab Name field, enter a name to serve as this dashboard's tab name when other tabs are present.
-
Add columns to the dashboard by doing the following:
-
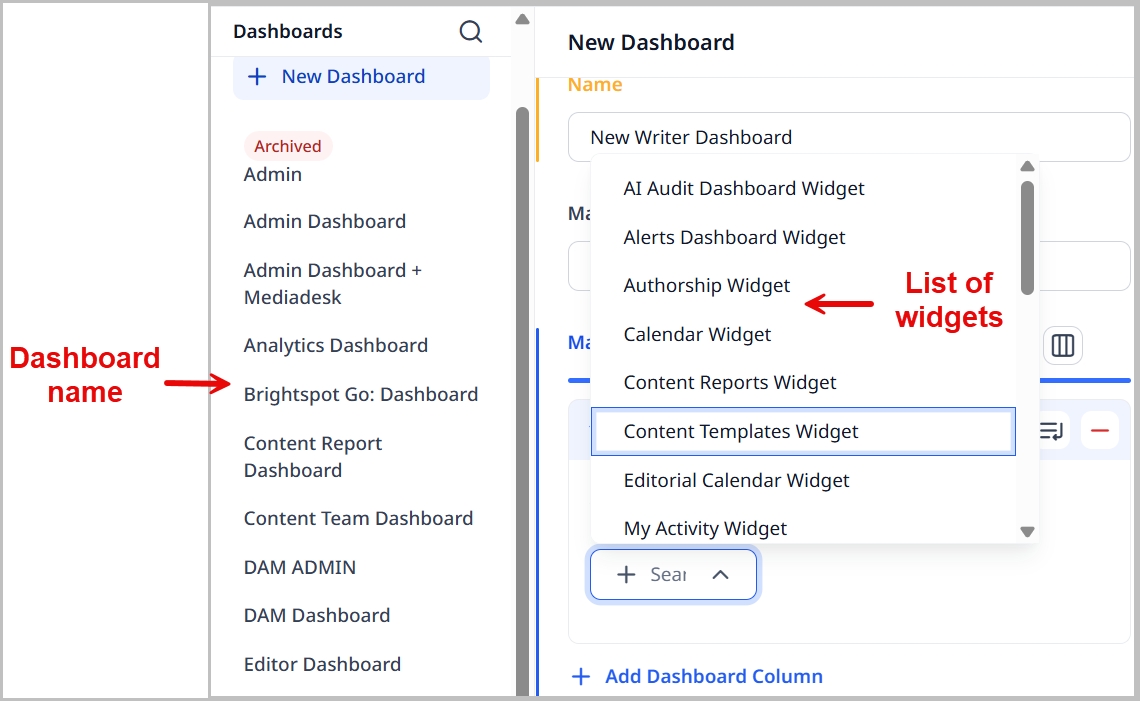
Under Main Tab Columns, click .
-
From the Widgets list, select a widget to include in the dashboard column. For a list of available widgets, see Dashboard widgets.
-
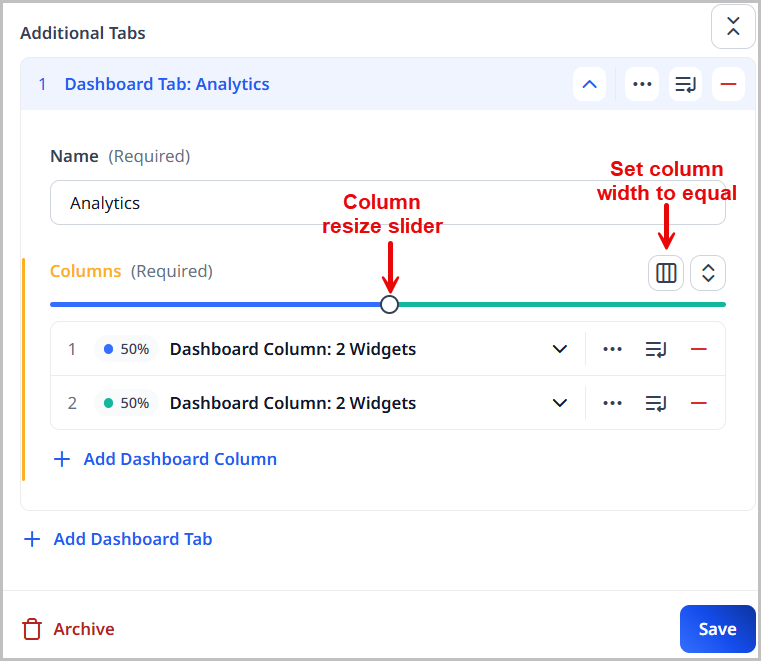
Resize the columns by dragging the resize button, or click to set all the column widths to be equal.
-
Repeat steps a–c to add more columns and widgets to the dashboard.
-
-
Add tabs to the dashboard by doing the following:
-
Under Additional Tabs, click .
-
Enter a name for the dashboard tab.
-
Click to add a dashboard column.
-
From the Widgets list, select a widget to include in the dashboard column. For a list of available widgets, see Dashboard widgets.
-
Resize the columns by dragging the resize button, or click to set all the column widths to be equal.
-
Repeat steps b–f to add more tabs to the dashboard.
-
-
Click Save.
Creating a shared dashboard
A shared dashboard can be shared to other sites, roles, or users. Once created, any other site, role, or user can reuse
- From the left navigation, under Admin, click Dashboards.
-
From the Dashboard or Default Dashboard list, select New Dashboard.
-
Enter a name for the dashboard. This name is used internally to reference this dashboard.
-
Add columns to the dashboard by doing the following:
-
Click to add a dashboard column.
-
From the Widgets list, select a widget to include in the dashboard column. For a list of available widgets, see Dashboard widgets.
-
Resize the columns by dragging the resize button, or click to set all the column widths to be equal.
-
Repeat steps a–c to add more columns and widgets to the dashboard.
-
-
Add tabs to the dashboard by doing the following:
-
Click > Tabs.
-
Under Tabs, click .
-
Enter a name for the dashboard tab.
-
Click to add a dashboard column.
-
From the Widgets list, select a widget to include in the dashboard column. For a list of available widgets, see Dashboard widgets.
-
Resize the columns by dragging the resize button, or click to set all the column widths to be equal.
-
Repeat steps b–f to add more tabs to the dashboard.
-
-
Click Save.
Applying shared dashboards
Once a shared dashboard has been created, it can be applied to various levels of the hierarchy. A shared dashboard is available at the same level or lower in the dashboard hierarchy. For example, dashboards created at the site level are available at the site, role, and user levels. (For an explanation of dashboard hierarchy, see Dashboard hierarchy).
- Do one of the following:
| To access the dashboard... | Start by... |
|---|---|
| At the global level | 1. From the left navigation, under Admin, click Sites & Settings, then select the Global site. 2. From the CMS tab, expand the Dashboard cluster. |
| At the site level | 1. From the left navigation, under Admin, click Sites & Settings. 2. Under Sites, click the site for which you want to apply a shared dashboard. 3. Under the CMS tab, expand the Dashboard cluster. |
| At the role level | 1. From the left navigation, under Admin, click Users & Roles. 2. Under Roles, click the role for which you want to apply a shared dashboard. 3. Toward the right of the widget, click > Dashboard. |
| At the user level | 1. From the left navigation, under Admin, click Users & Roles. 2. Under Users, click the user for which you want to apply a shared dashboard. 3. Under CMS, expand Dashboard. |
| As your default dashboard | 1. In the header, click your username, and then click Profile. 2. Under CMS, expand Dashboard. |
-
From the Dashboard or Default Dashboard list, select Shared.
-
Select the desired shared dashboard.
-
Click Save.
Dashboard widgets
Dashboards consist of widgets that provide various features to editorial teams.
Some widgets can simply be added to a dashboard while others require configuration.
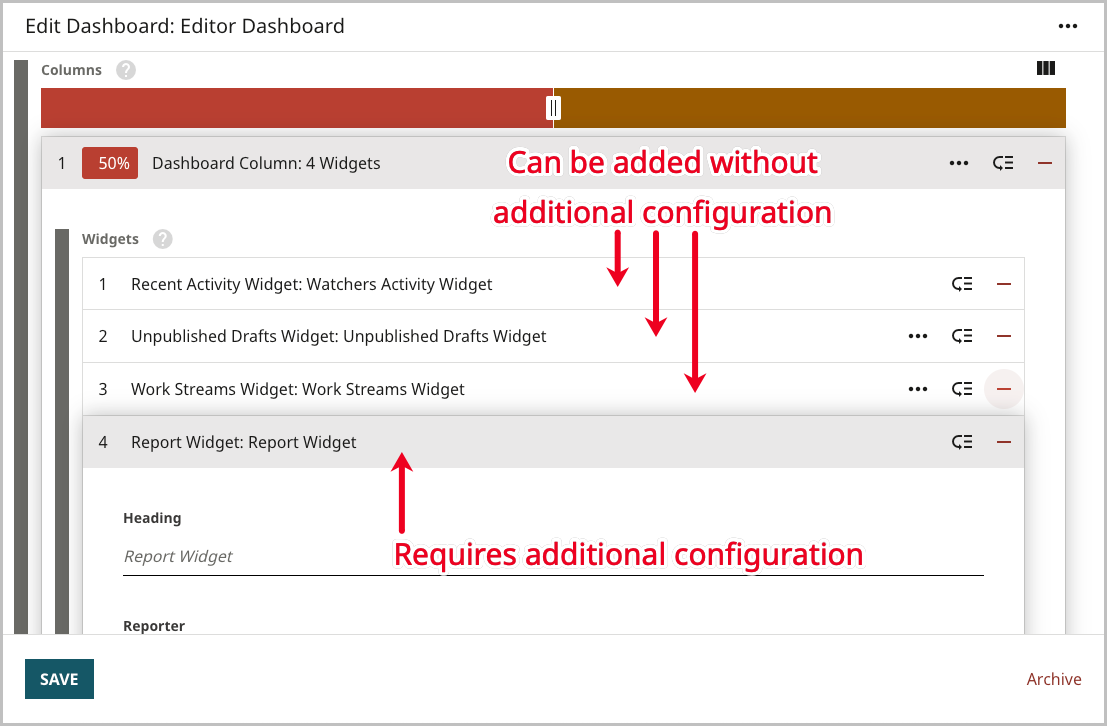
See the sections below for more details on common dashboard widgets.
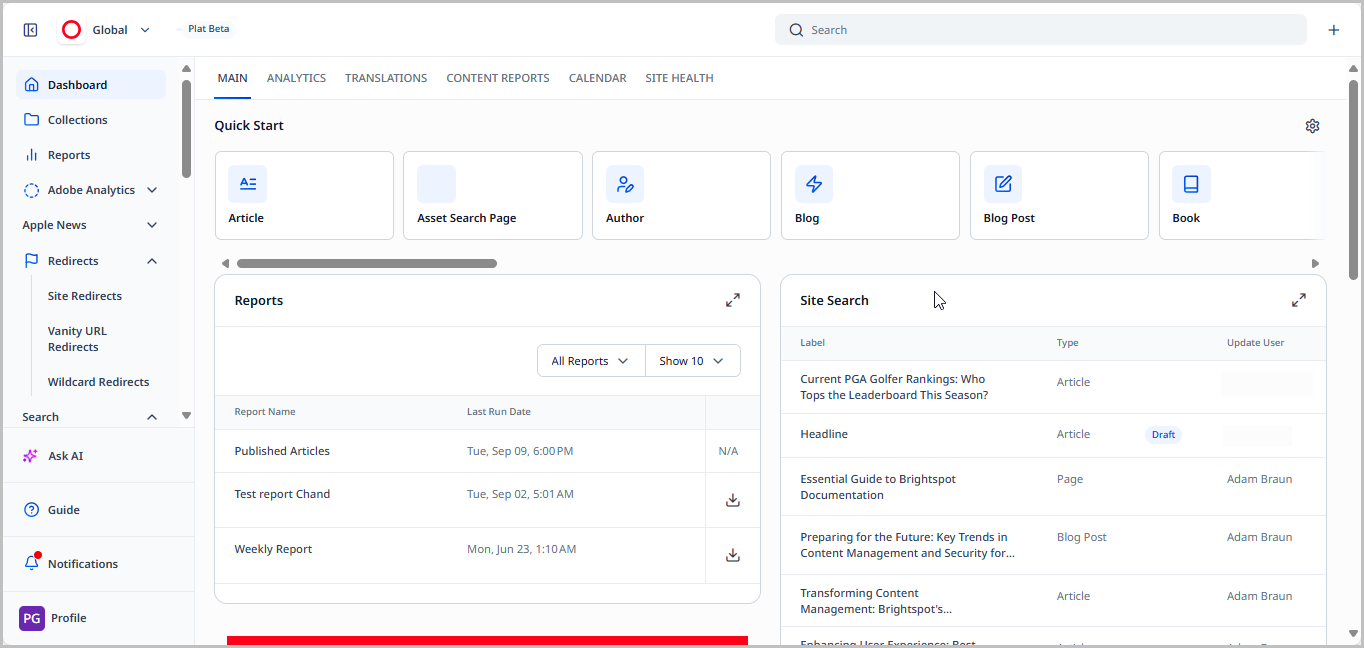
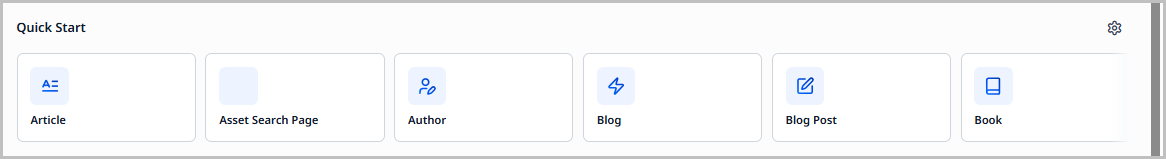
Quick Start
The Quick Start widget has quick links for creating new assets or editing existing ones.
Adding or removing items in the Quick Start widget
You can add or remove content types or individual assets to the Quick Start widget.
-
In the Quick Start widget, click .
-
Under Create New Types, check the content types you want to include in the Quick Start widget, and uncheck the ones that you want removed.
-
To add specific assets to the widget, do the following:
- Under Edit Existing Content, click Add Item.
- Click .
- Search for and select the assets you want to appear in the Quick Start widget.
- Close the content picker. You return to Edit Existing Contents.
- Click Save. Your assets are added to the Quick Start widget.
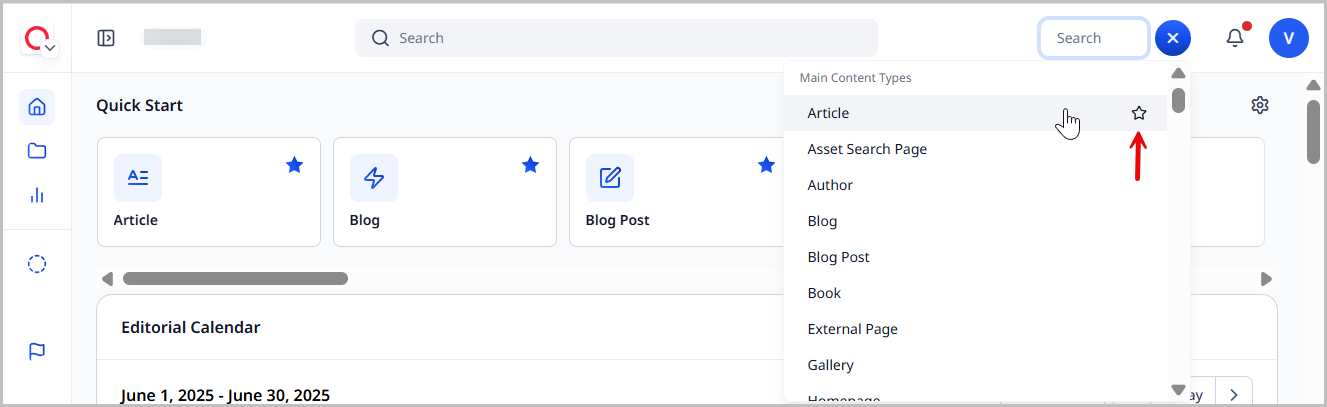
Favoriting items in the Quick Start widget
You can mark items in the Quick Start widget as favorites. Favorited items are reorganized to the left of the widget, eliminating the need to scroll for them.
-
From the Quick Start widget, hover over a content type or asset you want to make a favorite, and click the star located in the upper-right corner.
-
Refresh the page.
The assets that have been made favorites now show up on the left side of the Quick Start widget.

Recent Activity
The Recent Activity widget displays editors' activity in reverse chronological order. You can use this widget to open recently published or edited assets. You can filter the assets by type, editor, and status. The Recent Activity widget also supports a Quick View functionality that gives you an at-a-glance view of the fields included in an asset, as well as a preview of it on your site.
Report
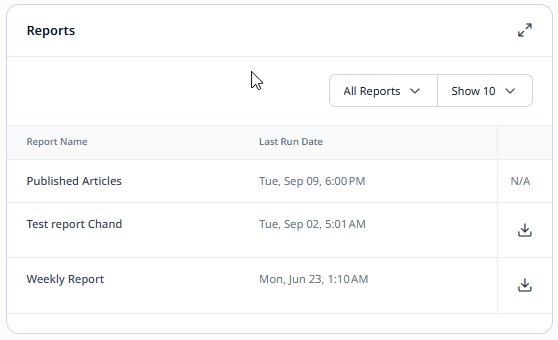
The Report widget provides tabular and graphical reports of your publication activity.
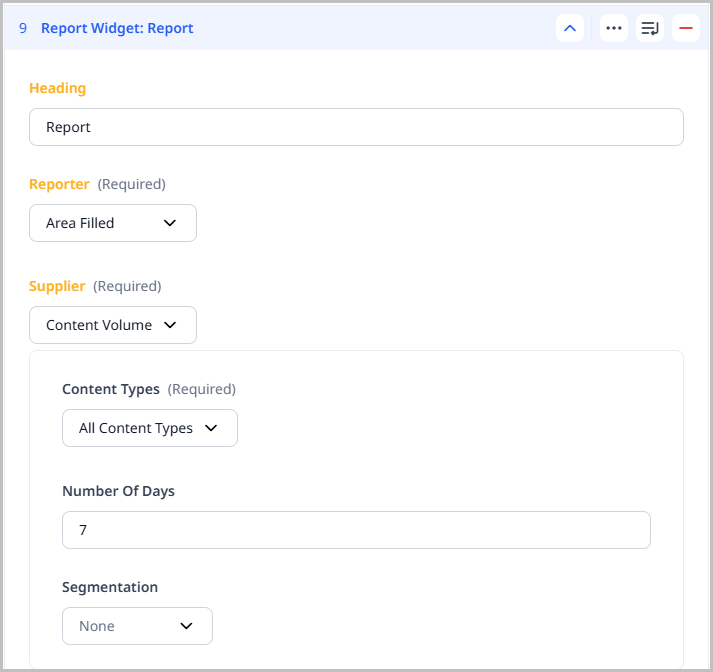
Configuring the Report widget
Site-level analytics appear in a Report widget on a dashboard. This topic describes how to configure Report widgets to display the required analytics.
- Create or open a shared or one-off dashboard that includes the Report widget.
- Using the following table as a reference, complete the fields as needed.
- Click Save.
Report widget options—Top-level fields
| Field | Description |
|---|---|
| Heading | Name of the report. |
| Reporter | Type of report (area, line, tabular, etc.). |
| Supplier | Report's data source. • Content Volume—The number of items published over the number of specified days. You can group the items by content type or field. See the Supplier—Content Volume settings tab below for additional field descriptions. • Numbers Over Time—A selection of metrics over a specified time, such as number of page views over the past seven days. See the Supplier—Numbers Over Time settings tab below for additional field descriptions. • Top Video Content—Report of the most popular video assets, based on different view metrics (for example, video views, watch time, video impressions). • Traffic Source—The channels by which visitors arrived to your site. See the Supplier—Traffic Source settings tab for additional field descriptions. • Video Watch Funnel—Aggregated watch funnel for all videos or selected videos. |
Supplier—Content Volume settings
| Field | Description |
|---|---|
| Content Types | Content types included in the report. |
| Number of Days | Number of days' activity included in the report. |
| Segmentation | Displays a different data series by content type or field value. • None—No segmentation, report represents all activity during the entered number of days. • Content Type Segmentation—Report segmented by content type during the entered number of days. • Field Segmentation—Report segmented by value of a selected field. For example, if you select Publish Date, Brightspot lists the number of items published for each date during the entered number of days. |
Supplier—Numbers Over Time settings
| Field | Description |
|---|---|
| Series | Data appearing in report. The Brightspot server is the source for all the following series except Google Analytics Custom Events and Google Analytics Data. • Average Time on Page—Average time visitors spent viewing pages. If one visitor viewed a page for one minute, and another visitor viewed a different page for two minutes, the average page view time is 1.5 minutes. • Google Analytics Custom Events—Retrieves Google Analytics data for a custom event configured in your Analytics console. • Google Analytics Data—Retrieves Google Analytics data for this report item. • Page Views—Number of times pages successfully loaded in a browser or device. • Site Search Volume—Number of site searches. For more information about adding site searches to your site, see Site search. • Unique Video Views—Number of unique video views lasting more than three seconds. A unique view is a unique device-user-browser combination that viewed a video. • Unique Visits—Number of unique visits. A unique visit is a unique device-user-browser combination that viewed an asset. • Video Average View Duration—Average time visitors spent viewing videos. If one visitor viewed a video for 5 minutes, and another visitor viewed a different video for 10 minutes, the video average view time is 7.5 minutes. • Video Impressions—Number of times videos were successfully loaded in a player on a page or device. • Video Starts—Number of times videos began playbook. • Video Views—Number of times video playbacks lasted at least three seconds. • Video Watch Time—Time visitors spent watching videos. • Visits—Number of times visitors requested assets, including those that did not load successfully in their browser or device. |
| Aggregate | Key by which Brightspot groups the data. • All—No grouping. • By Content—Grouping by individual items. • By Content Type—Grouping by content type. Grouping is not available for some series. |
| Period | Date range included in the report. For more information about this field, see Understanding time intervals for analytics. |
Supplier—Traffic Source settings
| Field | Description |
|---|---|
| Channels | Avenue by which visitor arrived to your site. • Direct—Visitor typed a URL in the browser. • Email—Visitor clicked a link in an email. Links from email channels are expected to use request parameter ch to be recognized, such as http://www.perfectsensedigital.com/?ch=email• Referral—Visitor arrived via a link from another site. • Search—Visitor arrived via a search engine. Brightspot tracks the Google, Bing, and Yahoo search engines by default. You can override the default search engines; for details, see Configuring analytics in Brightspot. • Social—Visitor arrived from a social network. Brightspot tracks the Twitter, Facebook, LinkedIn, and YouTube social networks by default. You can override the default social networks; for details, see Configuring analytics in Brightspot. |
| Period | Date range included in the report. For more information about this field, see Understanding time intervals for analytics. |
Your widget looks similar to the following:
Using the Report widget to track authorship volume and engagement
The Report widget allows you to select one or two fields to deliver granular analytics on your content. You can also select between different analytics providers or simply get an aggregated content count.
- Create or open a shared of one-off dashboard that includes the Report widget.
- Using the following table as a reference, complete the fields as needed.
- Click Save.
| Field | Description |
|---|---|
| Heading | Enter the heading for the Report widget. This heading is visible on the dashboard. |
| Reporter | Select the format used to display the data. |
| Supplier | Select Custom Grouping. This selection configures this widget to receive granular authorship volume and engagement metrics. |
| Types | Select the content types for which you would like to retrieve data. One or more types may be selected. If no types are selected, data for all available content types is retrieved. |
| Group By | Select how you want the data to be grouped. For example, if you want the data to be grouped by individual authors, select Authors. |
| Config | Select the grouping type for your data: • Single Grouping—View your data grouped by a single field. • Double Grouping—View your data grouped by two fields for more granular information. When selecting Double Grouping, you must also select your Secondary Group By option, which should not be the same selection you made in the Group By field earlier. |
| Fields | Expand the Fields menu and select the supplier for your analytics data. You can also select Content Volume, which provides a simple count of the content published. Once the Field selection is made, the Metrics field appears with all available metrics based on your selection. |
| Metrics | Select the Metric you want to be included in the Report widget. Available metrics depend on your Fields selection above. For Single Grouping: You can add multiple metrics by clicking in the Metric field. Important: Use the same data supplier for all metrics—do not mix and match data suppliers. Exception: Content Volume can be mixed with any data supplier. For Double Grouping: Select one metric that corresponds to your chosen data supplier. To add additional metrics, repeat the process of selecting the same data supplier and choosing additional metrics. |
| Period | Select the unit of measure for the time period that the widget will display data. |
| Time Zone | Select the time zone to use for the beginning and end of the period selection you made. This field is only visible after a Period is selected. |
| Amount | Enter the number of periods for which data is reported. For instance, if you selected Past Months and you enter the number 2, the Report widget displays data for the past two months. |
Resources
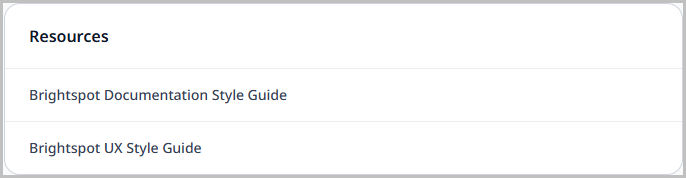
If you frequently refer to certain websites or files for source material, you can bookmark them in the Resources widget. Adding bookmarks to the Resources widget can make your work go faster, primarily because you don't need to repeatedly find the source material in search engines or your browser's bookmarks.
When you click on a link in the Resources widget, your browser downloads the file or displays the web page, depending on the type of resource and your browser's configuration.
Configuring the Resources widget
You can add frequently used websites or files to the Resources widget.
To configure the Resources widget:
- Create or open a shared or one-off dashboard that includes the Resources widget.
- Using the following table as a reference, complete the fields as needed.
- Click Save.
| Field | Description |
|---|---|
| Title | Enter a title. The title is visible to editors who have this widget available on their dashboard. |
| Items | Click , then select one of the following: • Resource File—Uploads a file to the Resources widget. You can name the file and specify whether its link opens in the same window or in a different window. • Resource Link—Adds a link to the Resources widget. You can name the link and specify whether it opens in the same window or in a different window. |
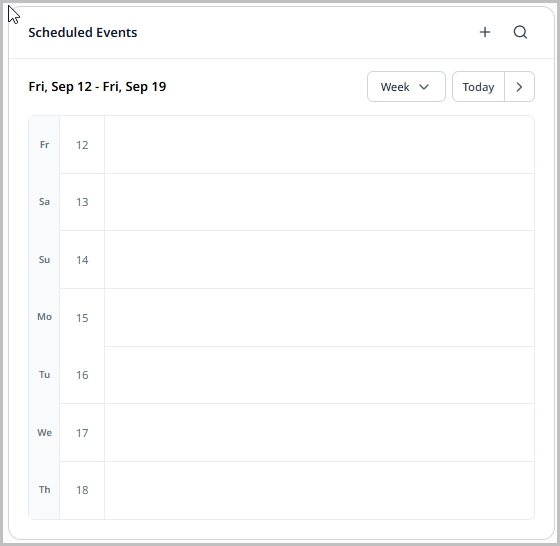
Scheduled Events
The Scheduled Events widget displays assets scheduled for future publication. By default, the widget shows scheduled changes for the upcoming week. You can page through previous and upcoming weeks, and you can view by day, week, or month.
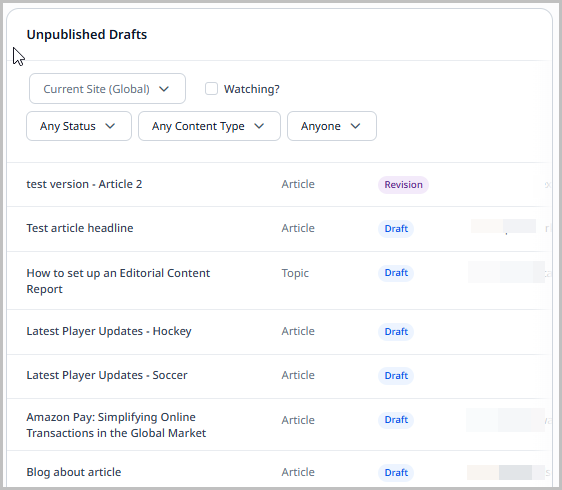
Unpublished Drafts
The Unpublished Drafts widget lists all saved but unpublished assets, including everything in your workflows. You can filter the assets by type, editor, and status.
Upload
Use the Upload widget to add files to Brightspot. This can be accomplished by clicking Select or by dragging and dropping files (individually or in bulk) directly into the widget. You can upload a large number of images, PDFs, videos, or almost any other file you need to incorporate into your own content. (Depending on your version of Brightspot, you may be able to upload only certain types of files, such as only PNGs and JPGs.)
Workstreams
The Workstreams widget lists the workstreams to which you can contribute as well as the progress of each workstream toward completion. You can filter the list of workstreams by making selections from the lists.
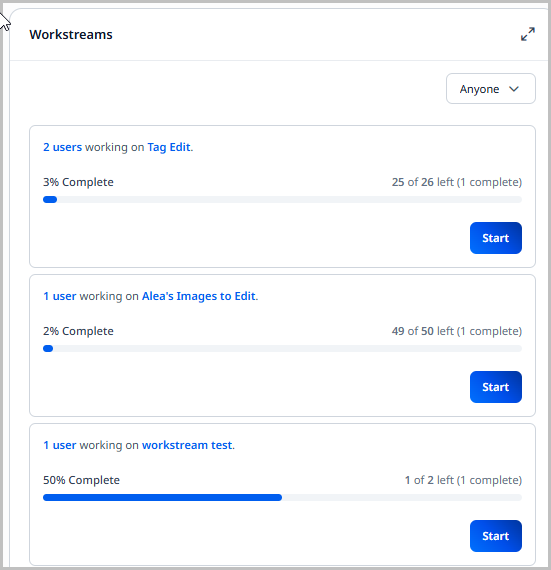
For detailed information about workstreams, see Workstreams.
Search
The Search widget displays the results of a query you define. Search widgets are useful when you frequently use a search condition and you want to see the results on your dashboard instead of in the search panel.
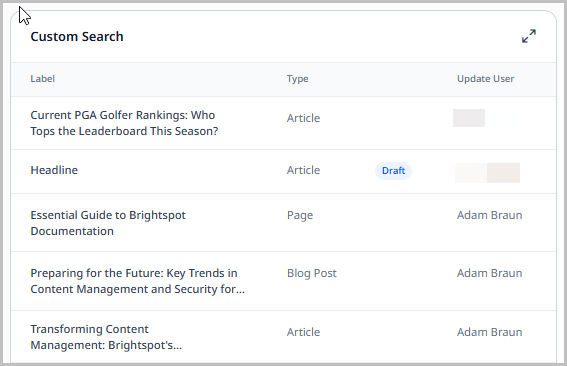
The previous illustration shows a search widget that displays images published in the current month.
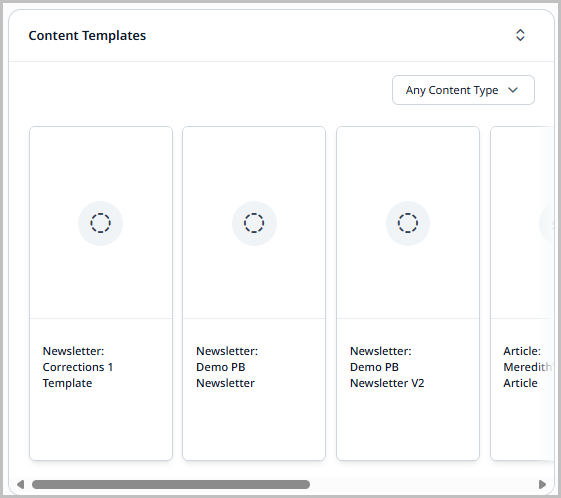
Content Templates
The Content Templates widget displays a carousel of the content templates that have been created for your site. You can filter the results by expanding the content type drop-down menu and selecting the content types whose custom content templates you want displayed in the widget. Those content templates that have a preview image uploaded display a preview, while those that do not display a standard icon that corresponds to the content type for the template.
Clicking the content template name or preview image takes you to a content edit page where you can create an asset using that content template. Clicking in the preview panel opens a pop-up that displays the description entered for that content template (if entered).
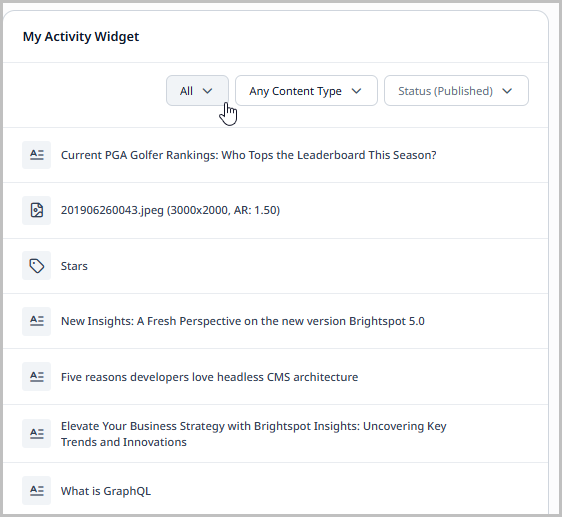
My Activity
The My Activity widget helps you easily and quickly find the assets you have published, updated, and viewed, as well as assets you are watching.

- Create or open a shared or one-off dashboard that includes the My Activity widget.
- (Optional) Give the widget a title.
- Click Save.
To use the My Activity widget:
-
Navigate to your dashboard.
-
Use the following filters to find assets.
- Activity filter—Allows you to view assets that you created, published, updated, viewed recently, or are watching.
- Content type filter—Allows you to specify which content types with which you want Brightspot to populate the widget.
- Status filter—Allows you to specify the status of the assets with which you want Brightspot to populate the widget. (for example, Draft, Published, etc.)
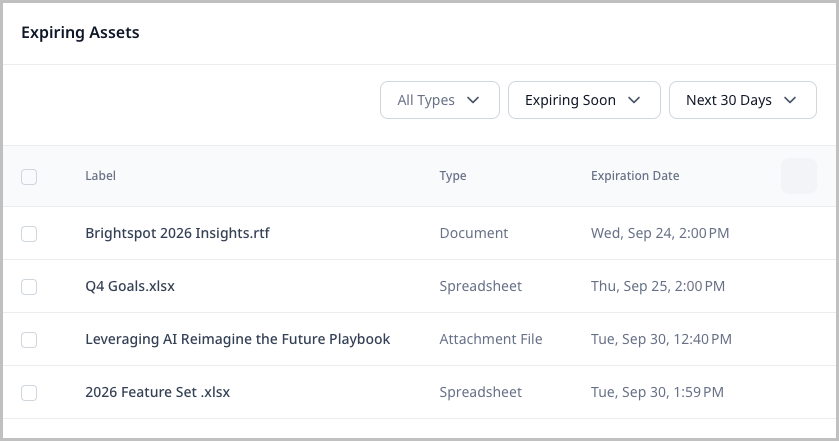
Expiring Assets
The Expiring Assets widget displays all of your media assets that implement expiration tracking in one place, letting you monitor and act on their expiration state.
To add the Expiring Assets widget:
- Create or open a shared or one-off dashboard.
- In the column you want to add the widget, under Widgets, click Add.
- Click Expiring Assets.
- Click Save.
To use the Expiring Assets widget:
- Navigate to your dashboard and locate the widget.
- Use the All Types dropdown list to filter by content type.
- Use the Expiration dropdown list to filter by expiration state:
- Not Expired—Assets that have not yet reached their expiration date.
- Expired (Hidden)—Assets that have expired and are no longer visible on the site. These had Discoverable After Expiration turned off at the time of expiration.
- Expired (Discoverable)—Assets that have expired but are still visible on the site. These had Discoverable After Expiration turned on at the time of expiration. Review these to decide whether they should remain published.
- View the individual asset line items. Each contains the following column headers:
- Label—The name of the media asset.
- Type—The type of media asset.
- Expiration Date—The date and time at which point the media asset expires.
- Bulk-Update—Click the checkmarks next to the media assets whose expiration date you want to bulk update. After selecting a new expiration date, click Done.
Authorship
The Authorship widget provides reports into your published assets' popularity and fills a reporting niche that is not easily met by historical reporting capabilities. This reporting is enabled through a new Group By report type, that enables an administrator to group results by one or two fields. The Authorship widget allows you to select which category to group your report by and to select between Brightspot Analytics or Google Analytics as the data supplier.
To configure the Authorship widget:
- Create or open a shared or one-off dashboard that includes the Authorship widget.
- Using the following table as a reference, complete the fields as needed.
- Click Save.
| Field | Description |
|---|---|
| Heading | Enter the heading for the Authorship widget. This heading is visible on the dashboard. |
| Authorship Supplier | Select the analytics supplier to provide the data for this widget. |
| Group By | Select how you want the data to be grouped. For example, if you want the data to be grouped by individual authors, select Authors. |
| Period | Select the unit of measurement for the time period used to display data. |
| Time Zone | Select the time zone to use for the beginning and end of the period selection you made. This field is only visible after a Period is selected. |
| Amount | Enter the number of periods for which data is reported. For instance, if you selected Past Months and you enter the number 2, the Authorship widget displays data for the past two months. |
Your widget looks similar to the following:
