Maximizing site performance
"Performance" for computer applications typically means response times: from the time you initiate a task, how much time is required to complete it? Before the Internet, application performance centered around input times (punch cards, keyboard, disk drive), processing times (microprocessor, memory), and output times (monitor, tape, disk drive, printer). Since the dawn of the Internet, an additional factor affects performance: network transport.
In today's application environment, input, processing, and output times are remarkably low. In fact, Brightspot runs on high-performance Amazon web servers that have accrued years of demonstrated reliability. Furthermore, Brightspot itself is optimized to ensure editors and visitors have a seamless experience. Editors quickly key in text, upload media, and find ancillary assets to use in their content. Visitors see web pages that are optimized for desktop or mobile screens. Nevertheless, the network infrastructure that transmits text and images over thousands of miles can cause delays.
Causes of poor performance
General industry research and research within Brightspot have isolated poor site performance to the following factors:
- Visitor's hardware—You are delivering content to an extremely wide audience, some of whom may have the latest mobile device, and others who may be running on obsolete desktops.
- Visitor's software—Visitors typically view sites in a web browser or in a mobile app. If your site is incompatible with a particular browser or browser version, the visitor may experience a performance hit. Similarly, if running an obsolete version of your mobile app, a visitor may perceive that your site is slow or not working.
- Connection type—Wireless connections appear to have matched or exceeded wired connections, but a particular visitor may be in a "dead zone" where wireless connection is poor.
- General network latency—There are times when the Internet, or your own site, is flooded with traffic, causing high resource load and subsequently reduced response times.
While all of these causes appear to be out of your control, you still need to be aware of them and make a decision if you want to account for them (for example, your site is running a big promotion that is expected to cause a large number of hits and corresponding server load). During that time, you may want to create assets with smaller payload, such as smaller images or shorter video clips.
Consequences of poor performance
If your site has poor performance, your visitors or your analytics will let you know. Without an indication that a web page is loading within a few seconds, a visitor will "bounce" to a different page. Visitors may message you directly, or complain about slow response times on social media.
The following image, taken from Find out how you stack up to new industry benchmarks for mobile page speed, shows how quickly the bounce rate climbs as page load times increase.
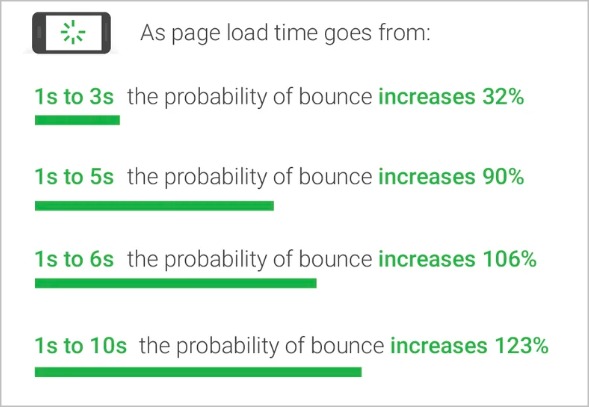
The conclusion is clear: if you want to keep visitors engaged, you need to keep your load times to a minimum.
Measures of performance
A site's performance is poor if visitors perceive it is poor. To measure that perception, all the tools listed in Recommended diagnostic tools use the following (each tool may have other metrics as well):
- First Contentful Paint—Time required to paint the first text or image.
- Speed Index—Time required to visibly populate a page's content.
- Time to Interactive—Time required until a page is interactive; this includes the time until all initially visible links respond to clicks or taps.
- Total Blocking Time—Sum of all time periods between First Contentful Paint and Time to Interactive, when task length exceeds 50 milliseconds, expressed in ms.
- Largest Contentful Paint—Time required to paint the largest text or image.
Recommended diagnostic tools
Technical support at Brightspot uses the following tools to evaluate a site's performance.
-
Lighthouse—This performance tool comes with Google Chrome. Lighthouse provides metrics for both desktop and mobile browsers, such as First Contentful Paint, Last Contentful Paint, and Time to Interactive. Lighthouse identifies bottlenecks in your page's rendering, and provides recommendations to resolve them.
-
PageSpeed—This free, online utility, based on the Lighthouse engine, also evaluates performance metrics, identifies bottlenecks, and provides recommendations. PageSpeed's results include a comparison between the URL you are testing and your site's overall domain.
-
WebPageTest Pro—This utility expands on the metrics provided by Lighthouse and PageSpeed. You can test your page's performance in different areas of the world, and test multiple URLs simultaneously.
-
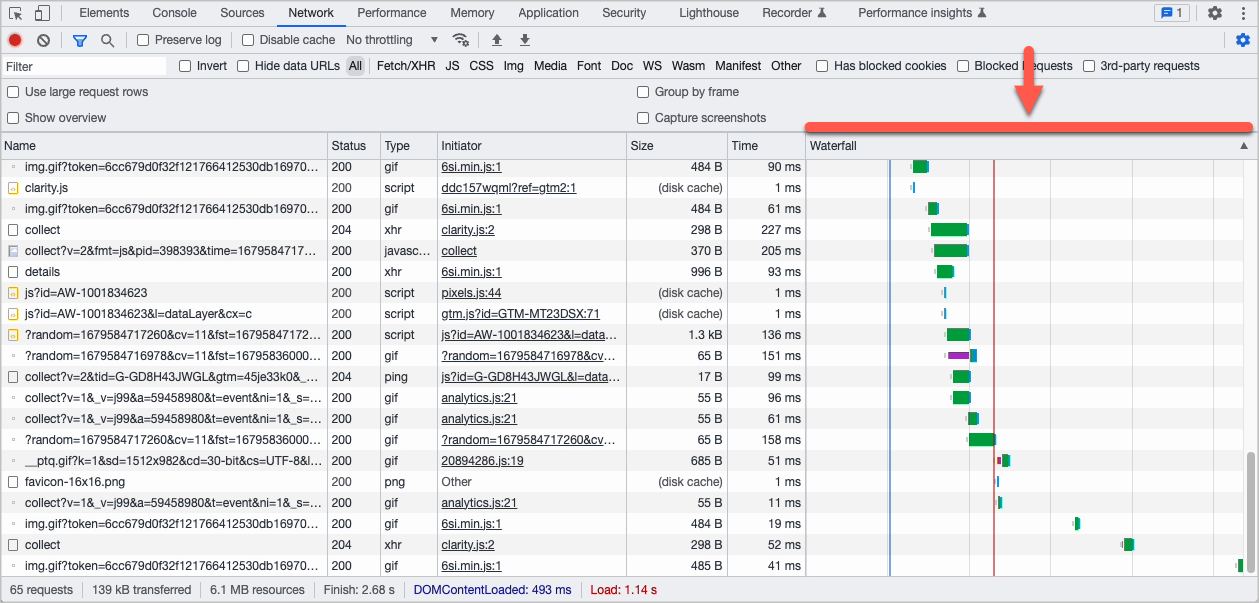
Waterfall diagrams—Popular desktop browsers provide developer tools that include waterfall diagrams. These diagrams list every request the browser makes to assemble a web page, when the request was initiated, and the time required to receive the result of each request. Requests that have delayed start times or long durations are good candidates for optimization.
You may want to test your pages in the following environments:
- Desktop Chrome browser over a custom cable connection (50 mbps down and 10 mbps up). This environment represents the best performance a visitor may experience.
- Mobile device (Android or iOS) and a mobile browser over a 4G connection. This is a typical environment from which your visitors are requesting content.
- Blocking all third-party traffic, such as ad injection or retrievals from social media. This "Brightspot only" environment measures the performance of content delivered from Brightspot servers. You can use these benchmarks to determine the contribution of third-party requests to poor performance.
#@ Remediating poor performance
Brightspot's technical support tests many customers' web sites and individual web pages. In almost every instance of poor performance, the main contributors are third-party requests and media formats. The following sections explain these causes and how to remediate them.
Minimizing third-party requests
Third-party requests are elements within your web pages that request content from a third-party site. Most of these requests are for ads from an ad service (such as Google AdSense) or for posts from social media. Each request sets off the entire HTTP request process: sending the request to the server, the server assembling the response, the server sending the response to the client, and the client processing the response. Given this extra network load, you should optimize your third-party requests.
- Reducing the number of third-party requests in a page increases the page's performance but possibly sacrifices ad revenue or social media engagement.
- Adding third-party requests in a page reduces the page's performance and increases the visitor bounce rate, but possibly sacrifices ad revenue or social media engagement.
Image formats
Almost every web page includes an image, and enterprise web sites often contain very attractive images with many colors. This richness adds enormous size to the image itself as well as the entire web page. In particular, some publishers upload very large native images (more than 10 mb) and use .png instead of .jpg. (For photographs, .png is larger than the same image saved as .jpg.) Selecting the correct format mitigates to a large extent the size of an image, and therefore the page's performance.
The recommended format for all images is WebP, which can reduce image sizes by 25%–30%.
Exploit lazy loading
Generally, web browsers load images as soon as possible, which can result in resource competition when loading multiple images, or loading images that can wait because they are outside the visitor's viewport (the visible portion of the web page). Modern browsers can use lazy loading to postpone retrieval of images outside the viewport. If your web pages have rich graphics that, upon initial load, are outside the viewport, consider asking your front-end developer to specify those images be loaded lazily. For more information about lazy loading, see Browser-level image lazy loading for the web and Native image lazy-loading for the web!.
Develop content for mobile first
Editors or graphic artists using Brightspot typically do so on a desktop with multiple screens, a wired network connection, and while working close to powerful servers. In this work environment, they may forget that their visitors are likely using a mobile device with a small screen and potentially moving in and out of WiFi or cellular coverage. As you develop text and graphics, keep in mind that visitors may not see the same rendition that you see. Consider using fewer ad injections, fewer media files, or smaller media files. Also consider using Brightspot's preview pane with mobile or tablet device sizes so you can see what your visitors see.
See also: